Station Dashboard
Introduction
The Station Dashboard displays individual station data in graphical and list form. Data is organized into tabs: Data Plots, Alarms, Elevation Profile, Forecast Plot, Photos/Diagrams. Graphs and tabs are enabled based on data availability for the selected station.
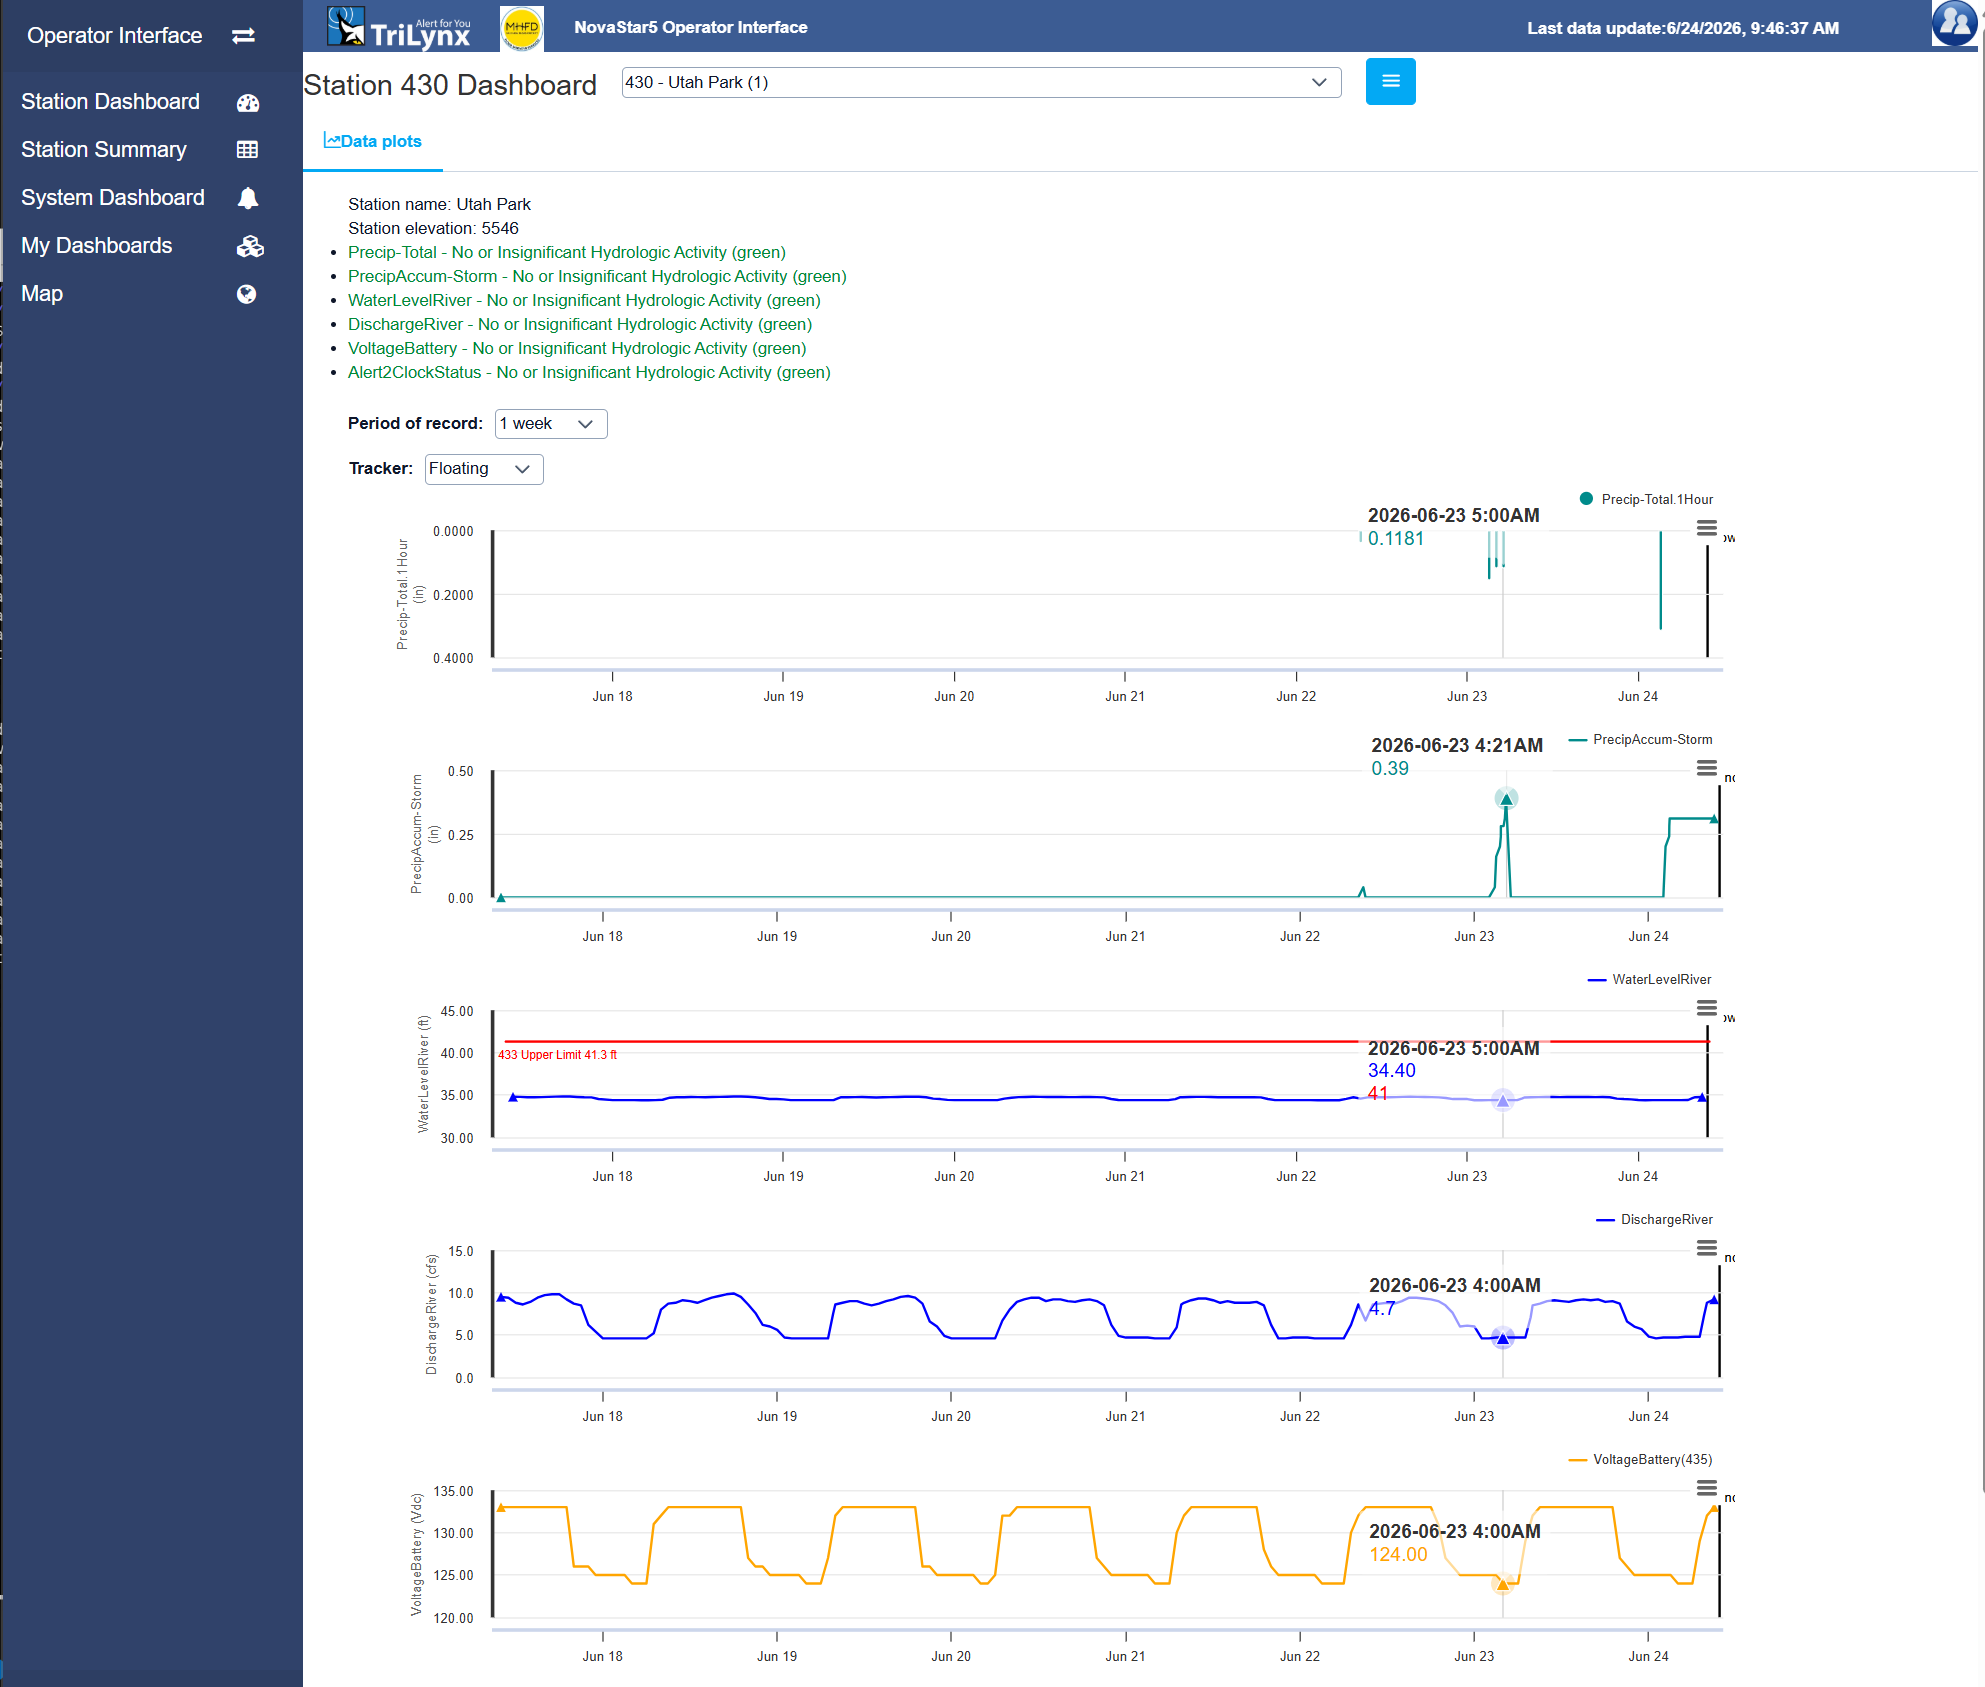 Station Dashboard (see full-size image)
Searchable
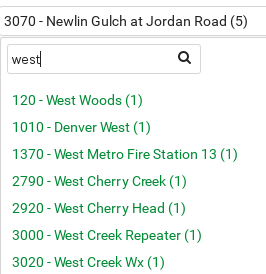
A list of all stations is located at the top of the Dashboard. This list is ordered first by NovaScore and second by station id. In other words, stations with the highest risk of potential problems are listed first in this list. The color of the station text matches the color of the marker on the map, both of which indicate the NovaScore.
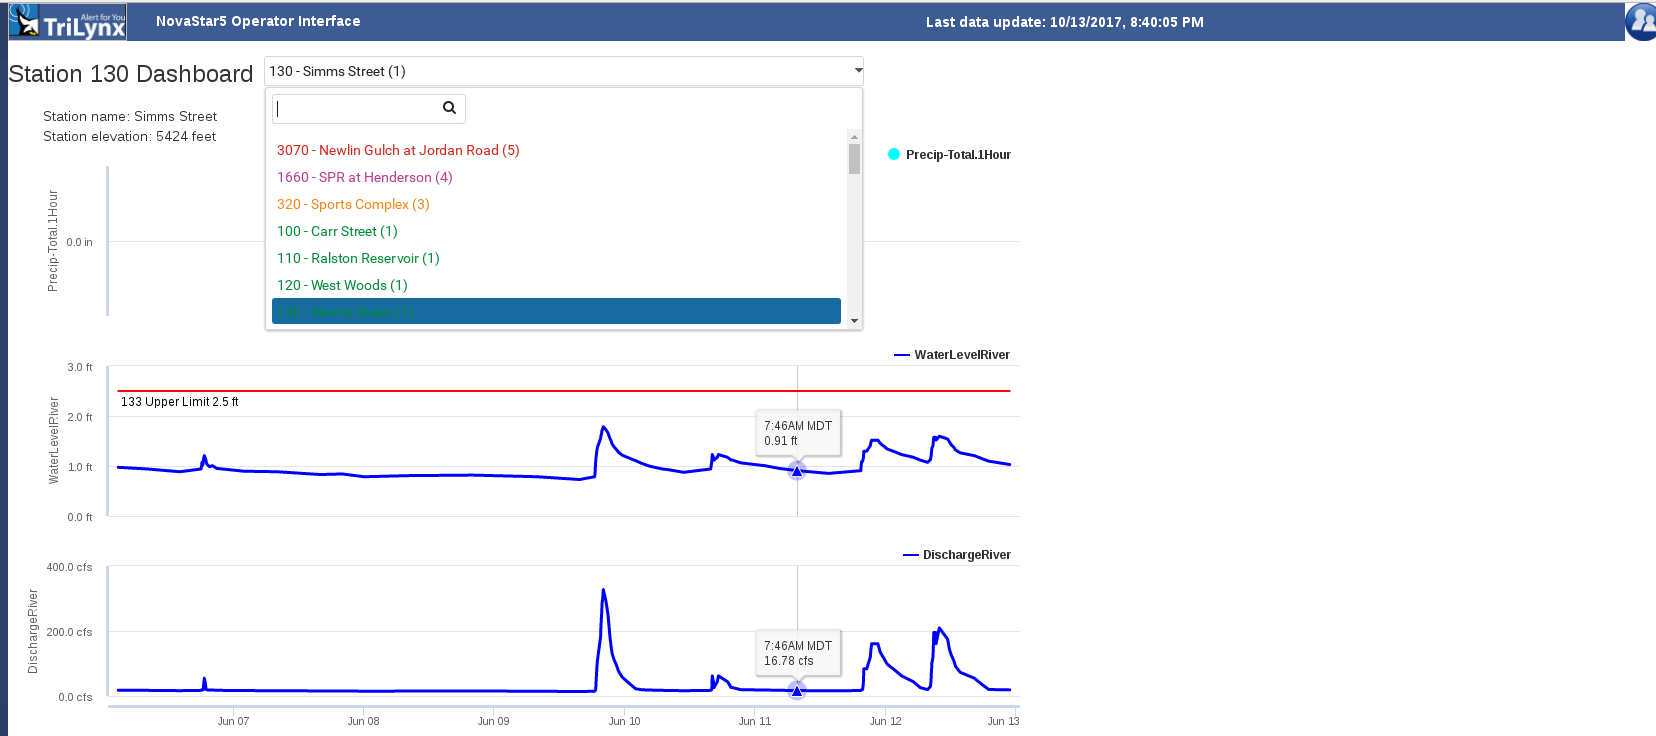
Note the top element in the list is an empty text area with a magnifying glass to the right.
As letters are typed in this area, the list is refined to show only stations with name or id having a matching sequence of letters.
Tabs
Data is organized into tabs: Data Plots, Alarms, Elevation Profile, Forecast Plot, Photos/Diagrams.
Data Plots Tab
Hourly precipitation is displayed and other data types display the instantaneous values. Graphs can be zoomed by clicking the left mouse button and dragging the cursor over the desired area. All graphs will be zoomed to the same time period. Once zoomed, a Reset zoom buttom appears on the interface.
Hovering over any part of the graph area will display the time and data value for the graph closest to the cursor location. This information location is based on the selected Tracker position: floating (follows the cursor) or fixed (upper left corner of the graph). Data for the other graphs is also displayed. Because not every data set contains the same time sequences, the closest time and data value is displayed.
Alarms on Data Plots
Alarms are triggered by conditions set in NovaStar. These alarms display on the station dashboard chart at the time corresponding to when the alarm was triggered.
Active alarms display a gold alarm icon; reset alarms display a gray alarm icon.
Hovering over the alarm icon displays alarm information.
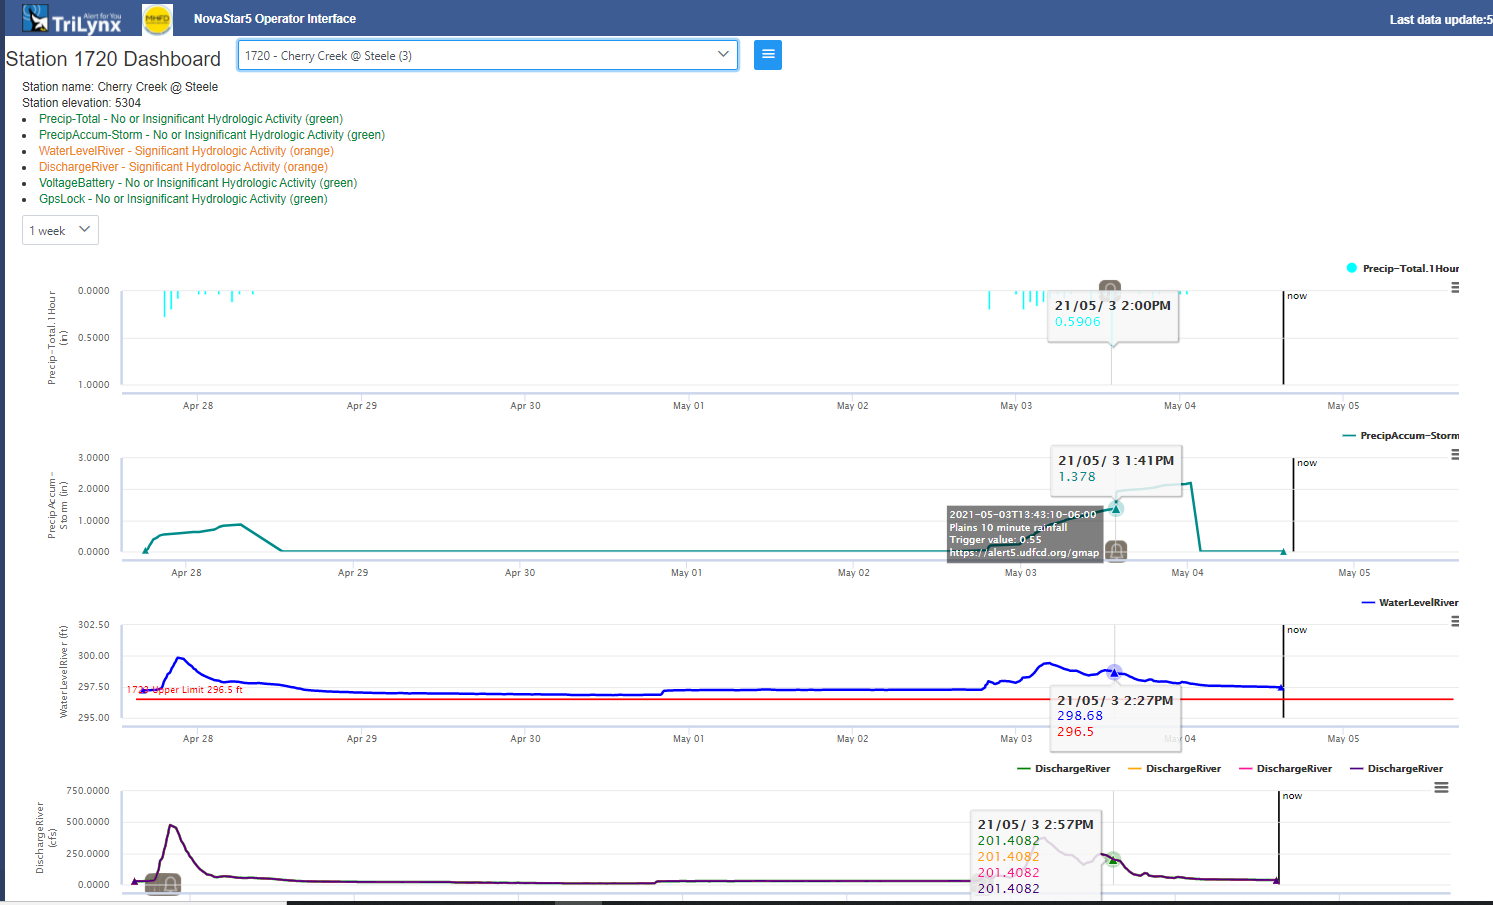 Alarm Information(see full-size image)
These alarms are also listed in a table format on the Alarms tab.
Period of Record
By default, one week of data is displayed in the charts. However, a longer period of record can be displayed by selecting a different time frame in the period of record pulldown.
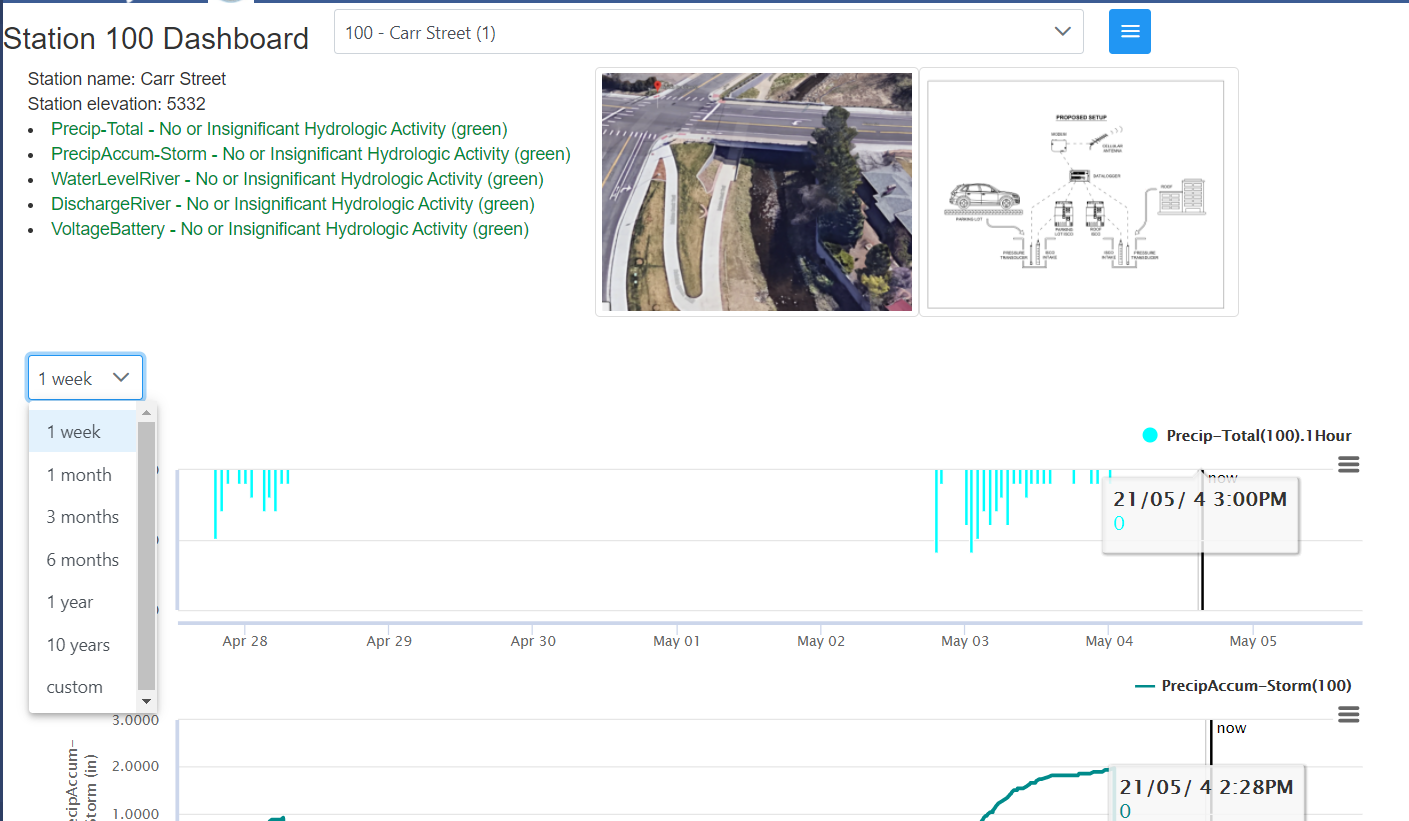
Among the obvious 3 hours, 6 hours ... 1 week, 1 month, etc., a custom option is provided to select a unique start and end date.

Download Chart Data
Two methods to download chart data are provided. First, the entire page of data can be downloaded in CSV or JSON format using the hamburger menu next to the station selection pulldown.
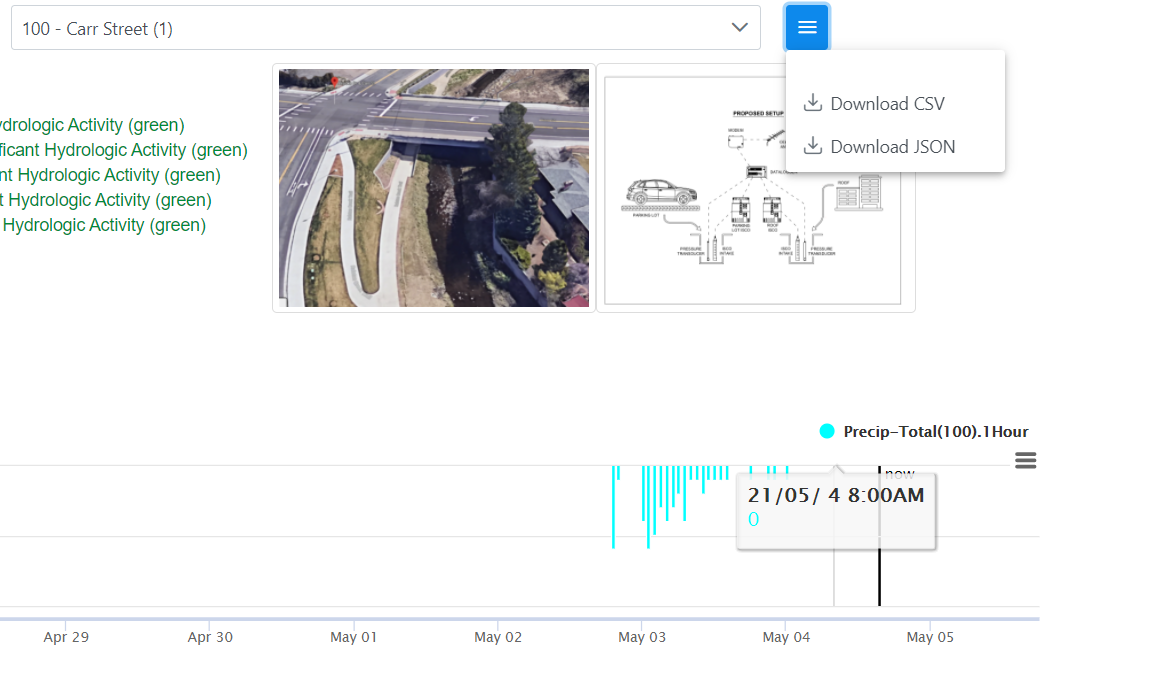
Second, individual chart data in many more formats is available using the hamburger menu next to each chart.
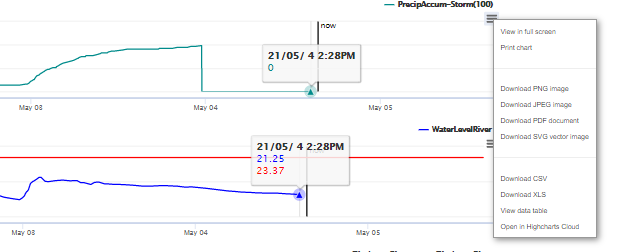
Alarms Tab
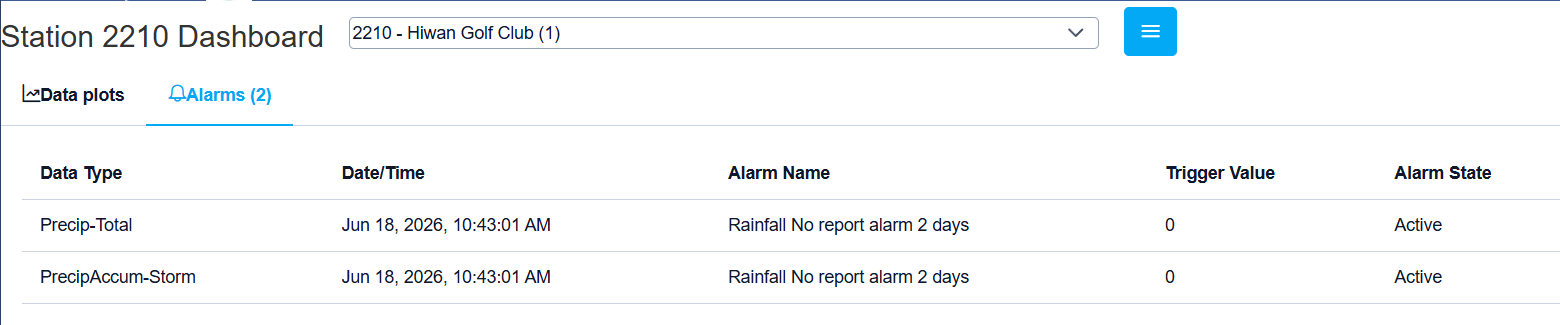
The Alarms Tab displays all alarms in tabular form. This tab only displays if there are alarms associated with the current station.
Elevation Profile
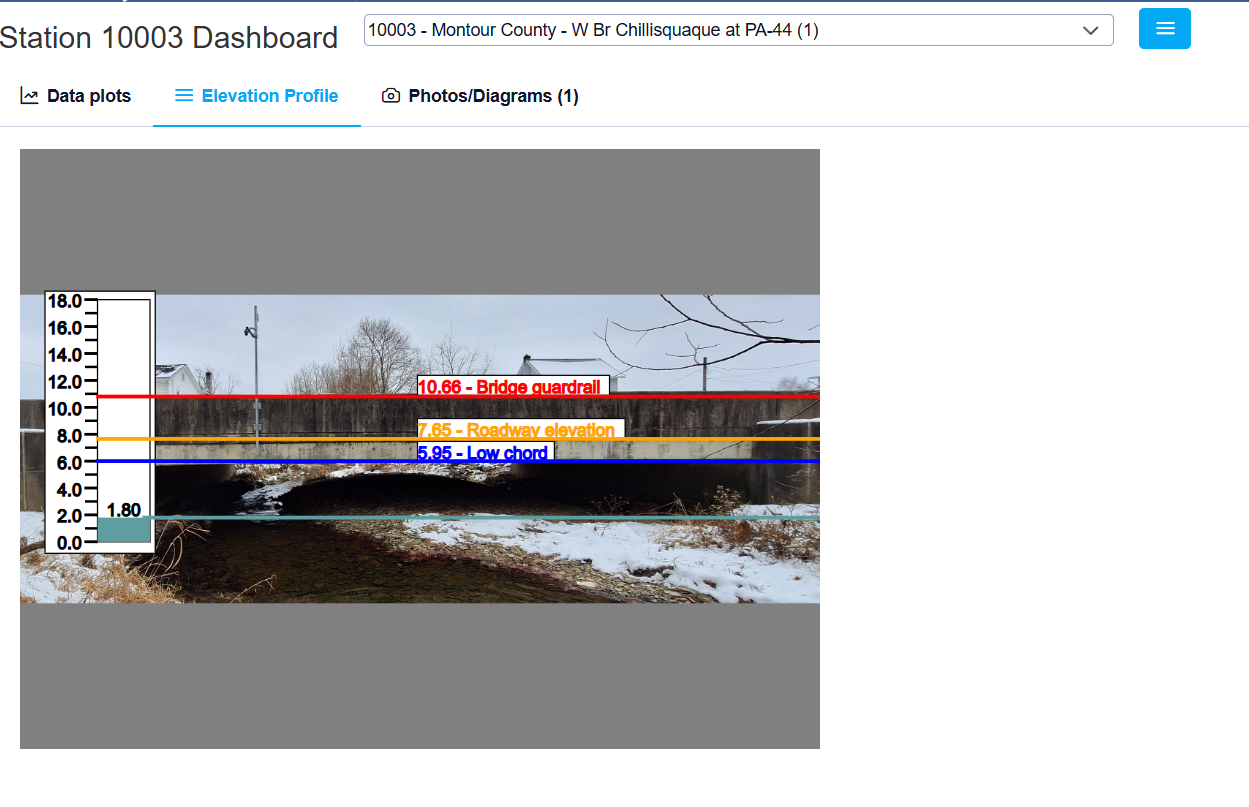
If properly configured, a station may display an elevation profile. In addition to the current water level, other points of reference may be displayed, such as bridge guard rails or the bridge low chord.
Forecast Plot
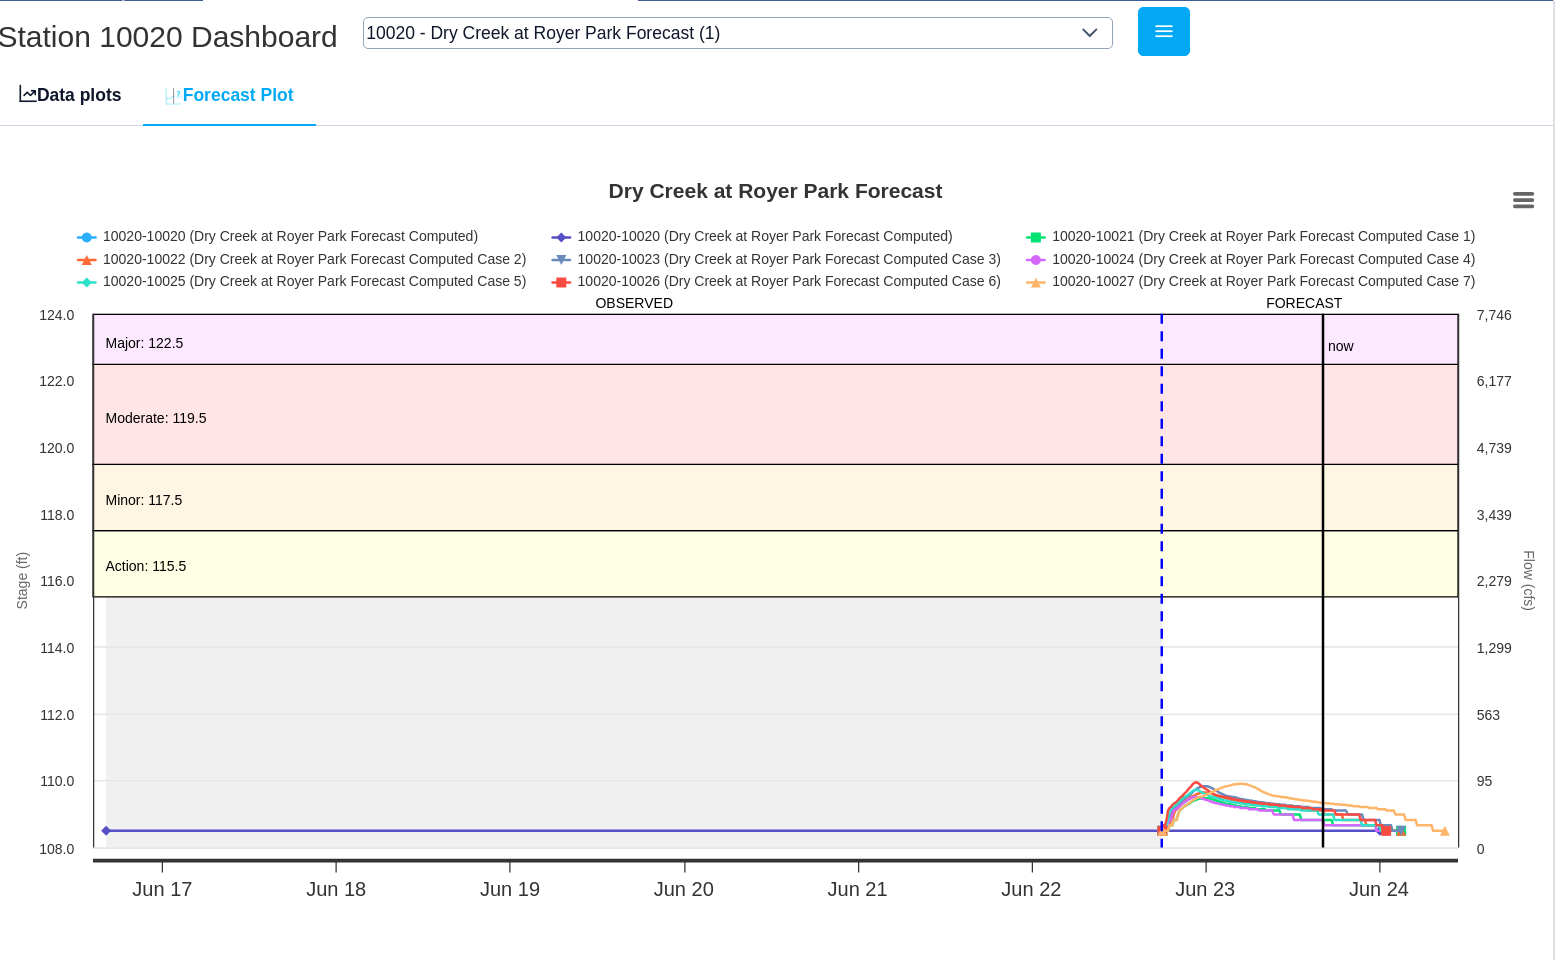
For forecast stations, a forecast plot is displayed.
Photos/Diagrams Tab
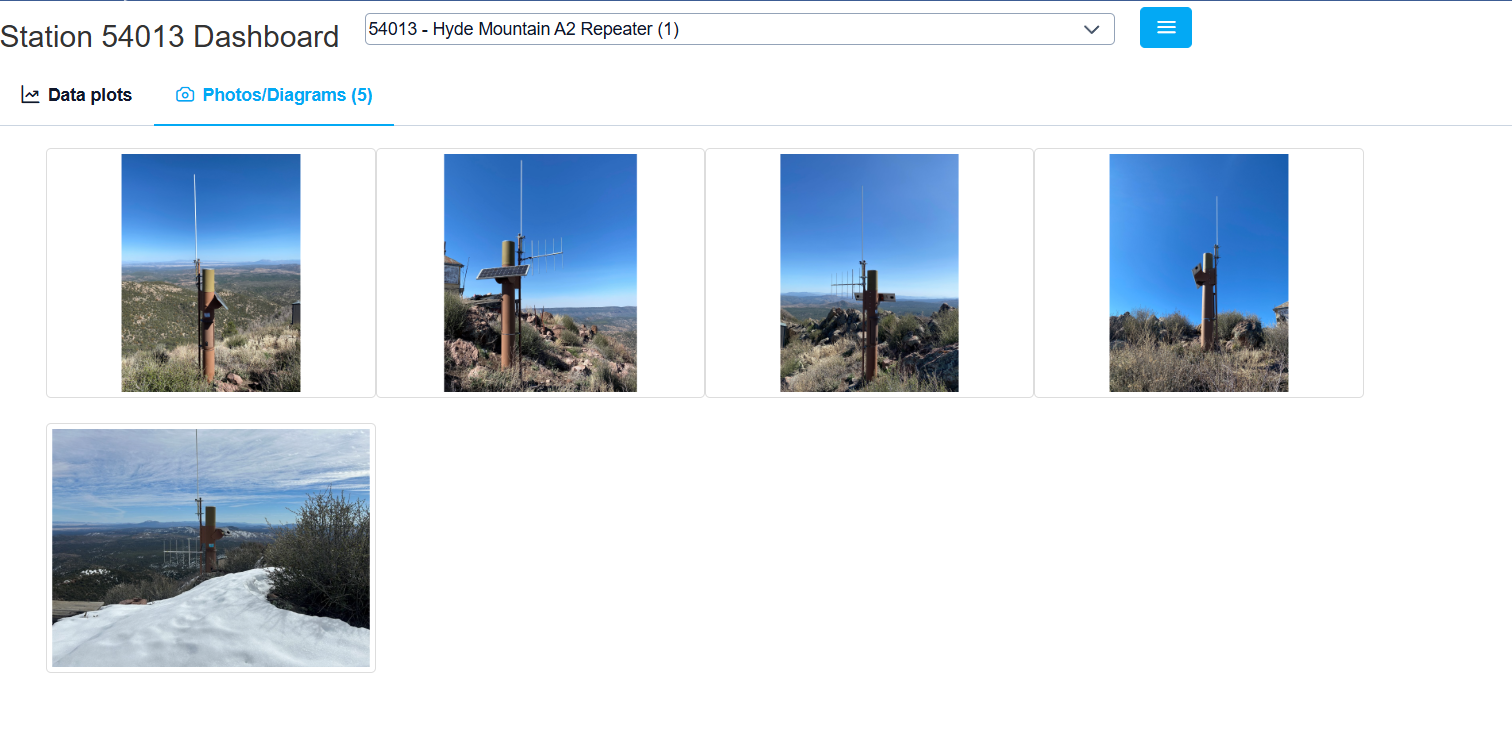
Note in the top portion above charts, some stations also provide photos or diagrams.
Once any image is clicked, all images associated with that station are displayed in a galleria, allowing larger viewing of images.